
 EN

Hydrogen Production Cost Benchmarking: How to Compare Project Assumptions
For a B2B buyer, the hydrogen cost of production is useful only when every project has been measured on the same basis. A headline number can look decisive and still conceal a different electricity source, operating profile, cost boundary, or currency year. This guide sets out a practical method for comparing green-hydrogen project models before a procurement, financing, or technology-selection decision.
The most reliable hydrogen cost of production comparison starts with a simple rule: treat each result as an assumption set, not as a standalone price. That approach is especially important when renewable power, electrolyzer sizing, and storage requirements differ from one project to another.
Start with one cost boundary
Before comparing the hydrogen cost of production, define what the number includes. “Stack outlet,” “plant gate,” and “delivered hydrogen” are not interchangeable. A plant-gate model may include water treatment, power conversion, balance of plant, and compression. A delivered-cost model can add storage, transport, and dispensing. If one offer stops at the electrolyzer outlet while another includes compression and onsite storage, the lower hydrogen cost of production is not automatically the better project.
Use a written boundary statement for every model. It should identify the hydrogen pressure, purity requirement, storage duration, grid connection scope, civil works, interconnection upgrades, and contingency treatment. This makes the hydrogen production cost discussion auditable rather than rhetorical.
Normalize electricity price, consumption, and utilization
Electricity is usually the first place where a hydrogen cost of production comparison goes wrong. Record the electricity price in the same currency year and state whether it is a flat tariff, a contracted renewable price, a blended portfolio price, or an hourly dispatch result. Also state whether transmission, demand charges, curtailment, and renewable certificates are included.
Next, use the same energy boundary. Is the quoted kWh/kg measured at the stack, at the electrolyzer package, or at the plant meter? A difference of a few kWh per kilogram materially changes the hydrogen cost of production when power is the dominant operating expense. The model should separate electrolyzer consumption from auxiliary loads such as water treatment, cooling, compression, and controls.
Capacity factor deserves equal attention. A DOE 2024 PEM scenario record illustrates this sensitivity: its modeled clean-hydrogen cases of roughly US$5–7/kg in 2022 dollars were tied to around US$0.03/kWh renewable electricity and capacity factors of approximately 50–75%. That is not a universal hydrogen cost of production benchmark; it is a reminder that price and utilization must travel with the result.
Compare capital cost on an installed, replaceable basis
For an honest hydrogen cost of production model, distinguish equipment supply cost from installed project cost. Include engineering, site preparation, electrical infrastructure, installation, commissioning, owner’s costs, and contingency on the same basis. State the reference year, exchange rate, escalation assumptions, and whether taxes or import duties are included.
Then make replacement assumptions visible. Stack replacement timing, replacement cost, degradation, and planned outages can materially affect lifetime output. Two projects with identical initial CAPEX can have a different hydrogen cost of production if one assumes an optimistic stack life or excludes future replacement labor. Ask for an annual production schedule rather than accepting a lifetime average without supporting assumptions.
Use an assumption ledger before comparing quotes
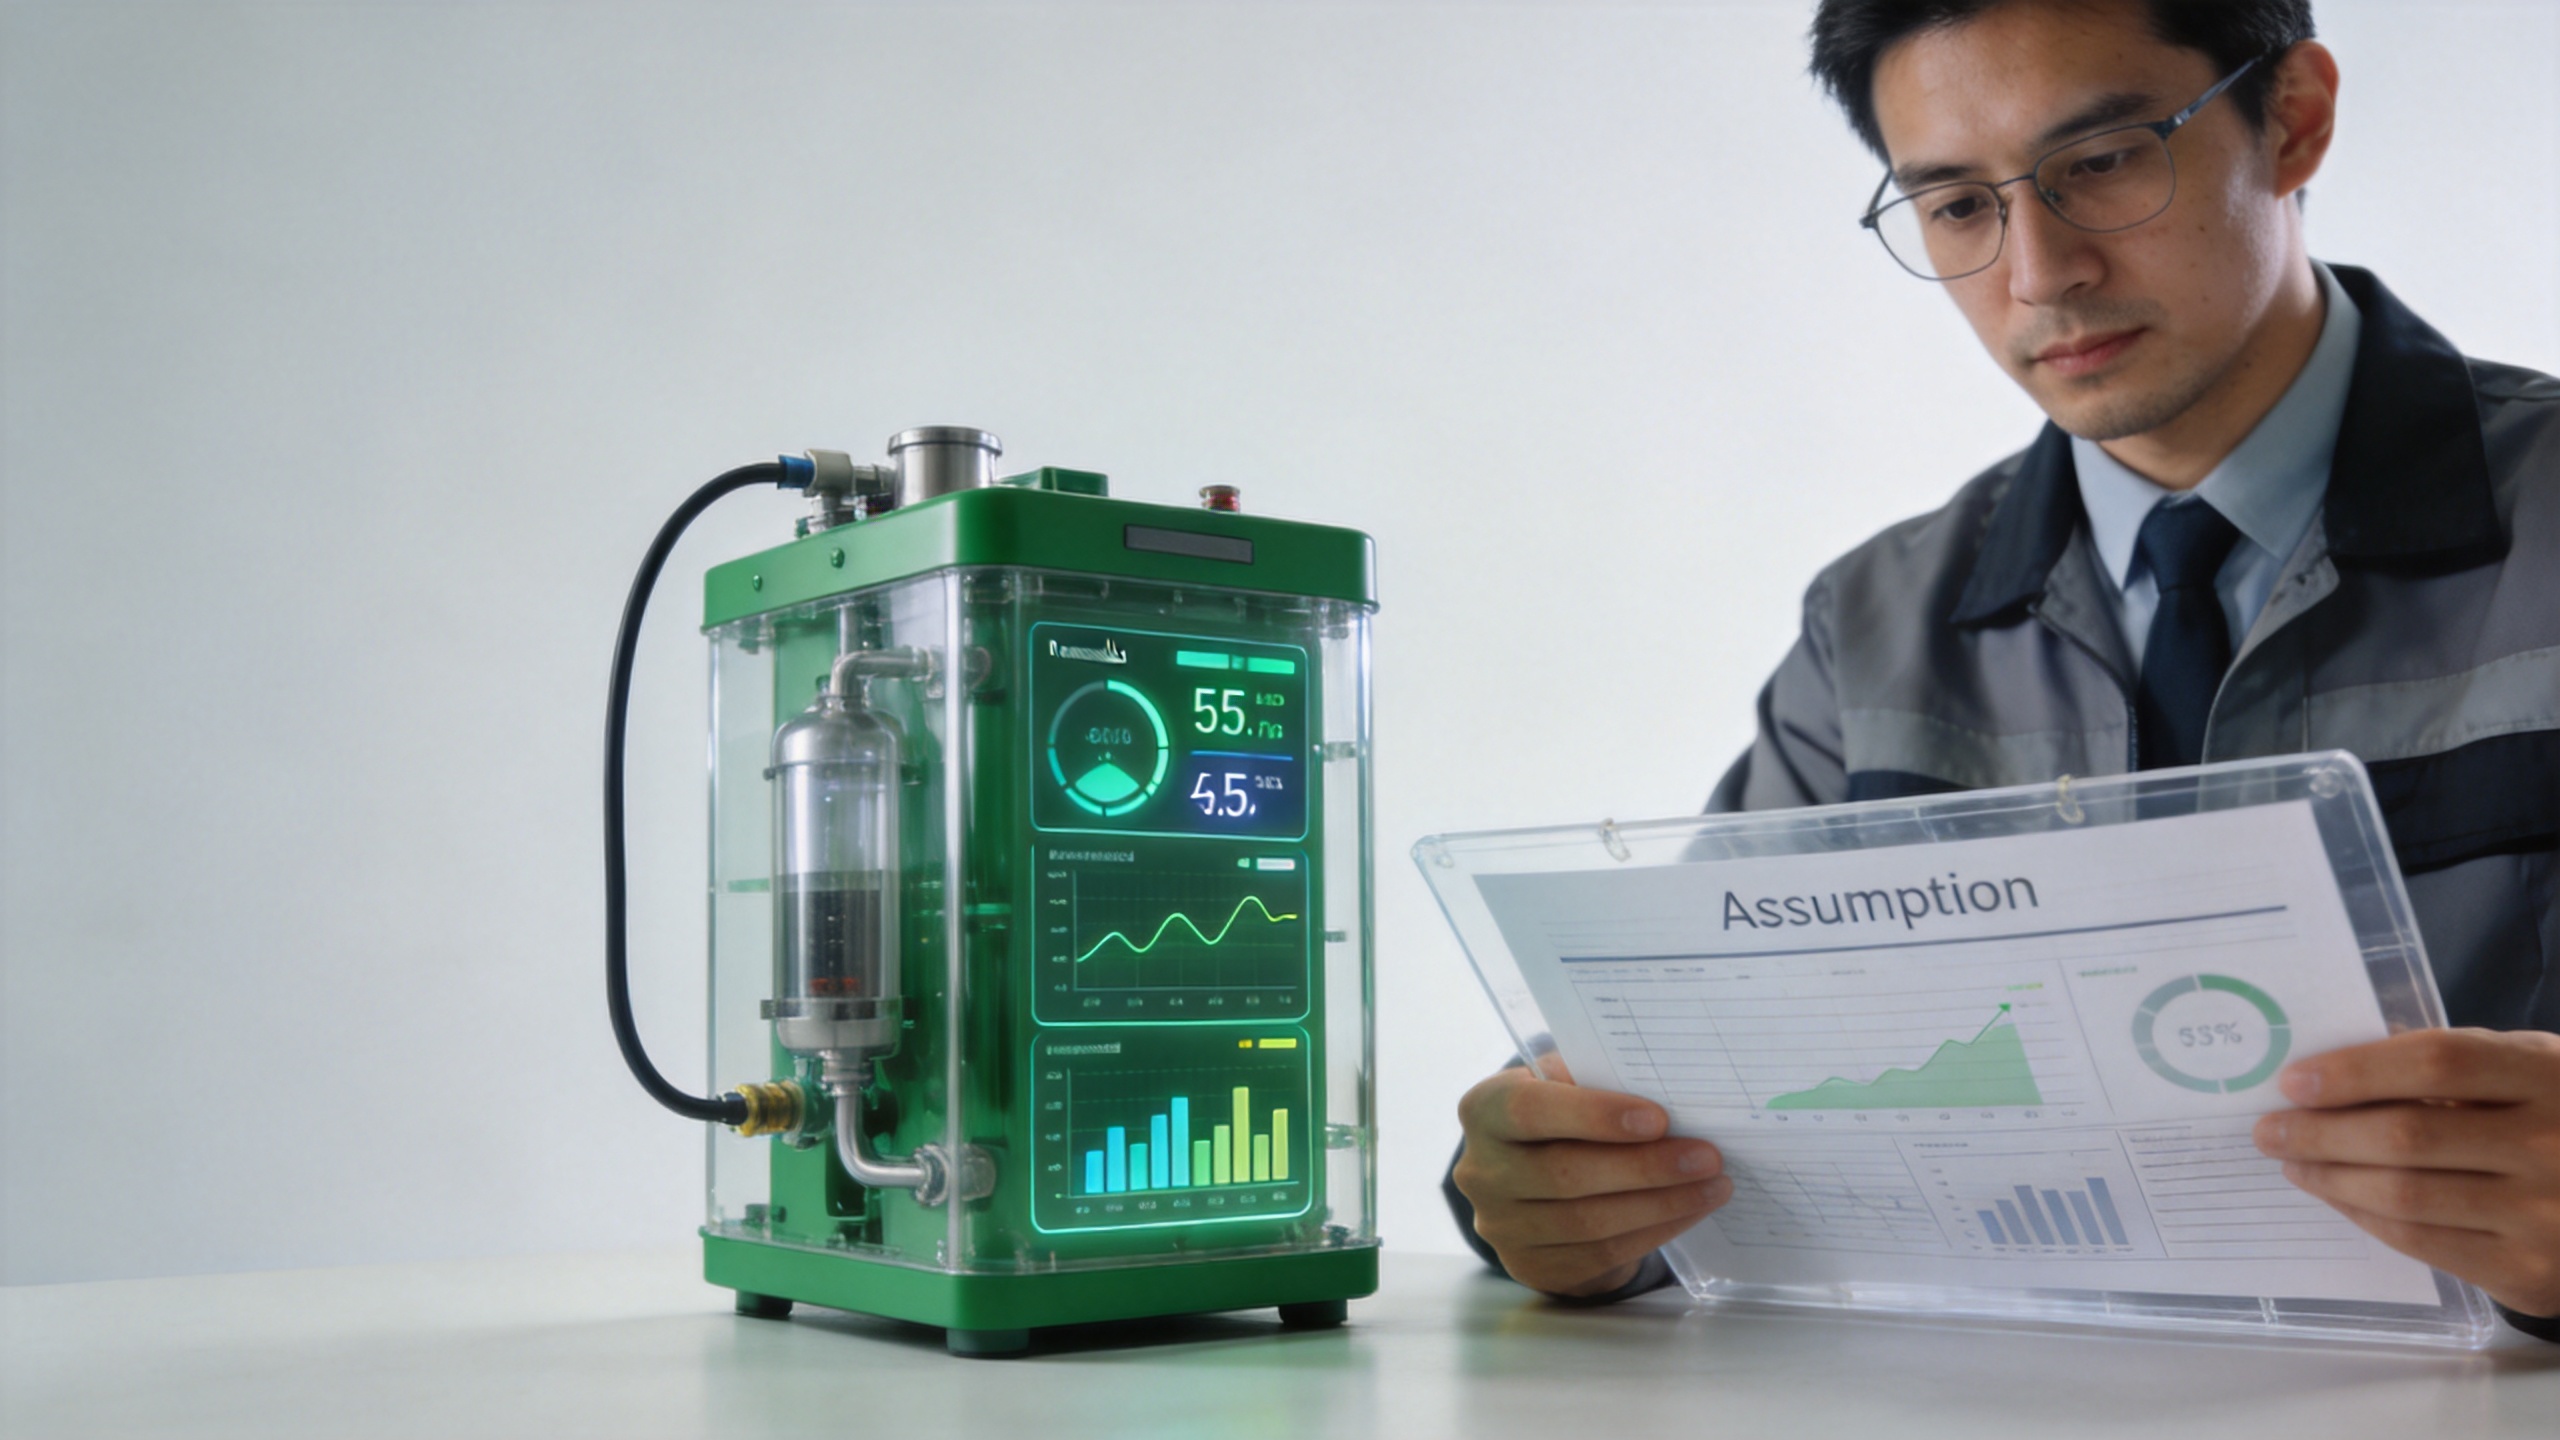
A compact assumption ledger prevents teams from comparing unlike cases. Build one row for every input that changes the hydrogen cost of production.
| Assumption | What to normalize | Why it matters |
|---|---|---|
| Electricity | Currency year, tariff type, grid fees, curtailment | Sets the largest operating-cost driver for most electrolytic cases. |
| Utilization | Annual operating hours, renewable profile, downtime | Changes how fixed cost is spread across each kilogram. |
| Energy use | Stack, package, and plant-meter kWh/kg | Prevents an understated hydrogen cost of production from a narrow efficiency boundary. |
| CAPEX | Installed scope, contingency, currency, escalation | Separates a vendor package quote from a project-ready cost. |
| Asset life | Project life, stack life, replacement schedule | Aligns lifecycle cost with lifecycle output. |
| Financing | Discount rate, debt/equity assumptions, incentives | Explains why otherwise similar projects report different results. |
For a quick screen, run low, base, and high cases for electricity price, capacity factor, and installed CAPEX. Report the resulting hydrogen cost of production range, then identify which input explains the widest spread. This is more decision-ready than defending a single-point estimate.
Separate technology comparisons from site comparisons
Do not assign every difference in hydrogen cost of production to electrolyzer technology. A project with cheaper electricity, higher operating hours, and simpler permitting may outperform a different technology at a constrained site. Compare technology alternatives under one shared site-and-power scenario first. Then compare site alternatives using a common technology and delivery boundary.
This distinction helps teams assess scalable equipment options without inventing performance claims. For example, project planning can consider confirmed product categories such as 100KW-500KW systems and 1MW-5MW systems, while retaining the same cost ledger for every capacity case. The hydrogen cost of production should still be calculated from the actual project assumptions, not from capacity labels alone.
Check output, not just nameplate capacity
Nameplate MW is not annual hydrogen output. To validate the hydrogen cost of production, request the modeled annual kilograms, the hourly operating logic, scheduled and unscheduled availability, water availability, and the assumed degradation path. Confirm whether the output is gross or net of commissioning, ramping, and planned maintenance.
Industry sources show broad reported ranges for green hydrogen, including a 3.9–8.9 EUR/kg range for certain European renewable-connected electrolysis cases. Such ranges are valuable context, but they do not replace a normalized hydrogen cost of production ledger. Their spread is precisely why assumptions must be comparable.
A practical review sequence for buyers
- Set one currency year, hydrogen boundary, and delivery condition.
- Normalize power price, operating hours, and plant-meter energy consumption.
- Rebuild installed CAPEX and replacement cost on the same scope.
- Calculate the hydrogen cost of production for low, base, and high cases.
- Rank sensitivity drivers and request evidence for the three largest assumptions.
- Only then compare suppliers, capacities, and project locations.
Done this way, hydrogen cost of production benchmarking becomes a transparent procurement tool. It reveals whether a lower number comes from a genuine system advantage or from a different modeling boundary. For green-hydrogen projects, that clarity supports better technical discussions, more credible budgets, and fewer surprises after the contract stage.